Monday, September 03, 2012


Poll Watch: High Point University/SurveyUSA North Carolina 2012 Presidential Survey
HPU/SurveyUSA North Carolina 2012 Presidential Poll
Survey of 543 registered voters was conducted August 26-30, 2012. The margin of error is +/- 4.3 percentage points. Party ID: 40% [37%] (38%) Democrat; 32% [33%] (30%) Republican; 23% [27%] (31%) Independent. Race: 70% [70%] White; 18% [19%] Black; 8% [7%] Hispanic; 4% [3%] Asian. Click here to view crosstabs. Results from the poll conducted August 19-23, 2012 are in square brackets. Results from the poll conducted June 29 - July 1, 2012 are in parentheses. Results from the poll conducted May 19-20, 2012 are in curly brackets. Results from the poll conducted February 27-28, 2012 are in square brackets. Results from the poll conducted January 9-11, 2012 are in parentheses. Results from the poll conducted September 22-25, 2011 are in parentheses.
- Mitt Romney 46% [43%] (50%) {47%} [46%] (48%) {50%}
- Barack Obama 43% [43%] (45%) {45%} [48%] (39%) {39%}
- Someone else 5% [6%] (3%)
- Undecided 6% [8%] (2%)
- Mitt Romney 52% [43%] (54%)
- Barack Obama 28% [37%] (36%)
- Someone else 9% [11%] (7%)
- Undecided 11% [10%] (3%)
- Mitt Romney 51% [43%] (54%)
- Barack Obama 41% [43%] (43%)
- Someone else 3% [9%] (3%)
- Undecided 5% [5%] (1%)
- Barack Obama 45% [43%] (48%)
- Mitt Romney 42% [43%] (46%)
- Someone else 7% [3%] (3%)
- Undecided 7% [11%] (3%)
- Mitt Romney 61% [54%] (59%)
- Barack Obama 28% [30%] (34%)
- Someone else 5% [7%] (4%)
- Undecided 6% [9%] (2%)
- Barack Obama 83% [87%] (85%)
- Mitt Romney 8% [6%] (14%)
- Someone else 0% [3%] (2%)
- Undecided 9% [4%] (0%)
- Approve 42%
- Disapprove 53%
Poll Watch: Rasmussen (R) 2012 Daily Swing State Presidential Tracking Survey
Rasmussen (R) 2012 Daily Swing State Presidential Tracking Poll
Survey of approximately 1,300 likely voters was conducted August 27 - September 2, 2012. The margin of error is +/- 3 percentage points. The swing state poll covers 11 key states: Colorado, Florida, Iowa, Michigan, Nevada, New Hampshire, North Carolina, Ohio, Pennsylvania, Virginia and Wisconsin. Results from the poll conducted August 26 - September 1, 2012 are in square brackets. Results from the poll conducted August 25-31, 2012 are in parentheses. Results from the poll conducted August 24-30, 2012 are in curly brackets. Results from the poll conducted August 23-29, 2012 are in square brackets. Results from the poll conducted August 22-28, 2012 are in parentheses. Results from the poll conducted August 21-27, 2012 are in curly brackets. Results from the poll conducted August 20-26, 2012 are in square brackets. Results from the poll conducted August 19-25, 2012 are in parentheses.- Mitt Romney 46% [46%] (45%) {45%} [43%] (44%) {44%} [44%] (45%)
- Barack Obama 44% [44%] (45%) {45%} [46%] (47%) {47%} [48%] (46%)
- Some other candidate 4% [4%] (4%) {4%} [4%] (4%) {3%} [3%] (4%)
- Undecided 5% [6%] (6%) {6%} [6%] (6%) {6%} [5%] (5%)
Currently, Romney is supported by 92% of swing state Republicans, while Obama picks up 82% of swing state Democrats. The president has a two-point edge among swing state unaffiliated voters.
The president’s job approval in the swing states is currently 47%. That’s down four points from a week ago. Fifty-two percent (52%) disapprove. Those figures include 26% who strongly approve and 41% who strongly disapprove.
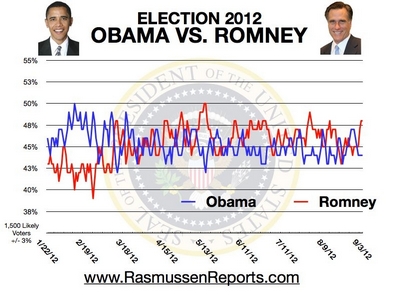
Poll Watch: Rasmussen (R) 2012 Daily Presidential Tracking Survey
Rasmussen (R) 2012 Daily Presidential Tracking Poll
- Mitt Romney 48%
- Barack Obama 44%
- Some other candidate 2%
- Undecided 5%
Survey of 1,500 likely voters was conducted August 31 - September 2, 2012. The margin of error is +/- 3 percentage points. Party ID: 35.97% Republican; 33.77% Democrat; 30.27% Independent. Daily tracking results are collected via telephone surveys of 500 likely voters per night and reported on a three-day rolling average basis. To reach those who have abandoned traditional landline telephones, Rasmussen Reports uses an online survey tool to interview randomly selected participants from a demographically diverse panel.

Poll Watch: Elon University/Charlotte Observer North Carolina 2012 Presidential Survey
Elon University/Charlotte Observer North Carolina 2012 Presidential Poll
- Mitt Romney 47%
- Barack Obama 43%
Inside the numbers:
One reason for Romney’s edge: By a margin of 52 percent to 39 percent, North Carolina voters say he would do a better job handling the economy.
While Romney enjoys a 12-point lead among male voters, the candidates are virtually tied among women.
Romney has made no inroads among African American voters. Only 1 percent of black voters support him, while 89 percent back Obama. Ten percent say they don’t know or refused to answer.
Romney has a 3-point edge when voters were asked which candidate most shared their values.
Fifty-one percent of Romney supporters described themselves as “very excited” compared to 47 percent of Obama voters.
Poll Watch: PPP (D) Florida Survey on Senator Marco Rubio
PPP (D) Florida Poll on Sen. Marco Rubio
Do you approve or disapprove of Senator Marco Rubio’s job performance?
Do you approve or disapprove of Senator Marco Rubio’s job performance?
- Approve 51% [45%] (44%) {43%} [40%] (44%) {42%} [43%]
- Disapprove 33% [42%] (40%) {41%} [40%] (39%) {35%} [31%]
- Approve 26% [19%] (20%) {15%} [19%] (16%) {17%} [17%]
- Disapprove 51% [65%] (64%) {68%} [59%] (68%) {55%} [51%]
- Approve 85% [74%] (71%) {74%} [65%] (82%) {75%} [70%]
- Disapprove 11% [17%] (17%) {10%} [17%] (6%) {13%} [10%]
- Approve 42% [44%] (37%) {35%} [34%] (34%) {36%} [44%]
- Disapprove 38% [45%] (39%) {50%} [45%] (43%) {30%} [31%]
Among Moderates
- Approve 42% [34%] (25%) {32%} [29%] (31%) {27%} [21%]
- Disapprove 39% [53%] (53%) {44%} [46%] (50%) {45%} [47%]
Among Men
- Approve 51% [47%] (50%) {50%} [42%] (45%) {47%} [50%]
- Disapprove 38% [45%] (34%) {40%} [44%] (41%) {32%} [30%]
Among Women
- Approve 52% [44%] (37%) {38%} [37%] (44%) {37%} [35%]
- Disapprove 29% [40%] (47%) {42%} [37%] (37%) {37%} [31%]
Among Whites
- Approve 56% [53%] (50%) {50%} [46%] (53%) {49%} [49%]
- Disapprove 31% [37%] (35%) {35%} [35%] (33%) {30%} [29%]
Among Hispanics
- Approve 54% [41%] (39%) {39%} [35%] (31%) {46%} [41%]
- Disapprove 29% [47%] (48%) {52%} [52%] (56%) {34%} [30%]
Poll Watch: PPP (D) North Carolina 2012 Presidential Survey
PPP (D) North Carolina 2012 Presidential Poll
- Barack Obama 48%
- Mitt Romney 48%
- Mitt Romney 51%
- Barack Obama 40%
- Barack Obama 58%
- Mitt Romney 35%
- Mitt Romney 52%
- Barack Obama 44%
- Barack Obama 51%
- Mitt Romney 44%
- Paul Ryan 46% / 42% {+4%}
- Mitt Romney 47% / 48% {-1%}
- Paul Ryan 52% / 41% {+11%}
- Mitt Romney 47% / 44% {+3%}
- Paul Ryan 33% / 52% {-19%}
- Mitt Romney 32% / 60% {-28%}
- Paul Ryan 50% / 41% {+9%}
- Mitt Romney 49% / 46% {+3%}
- Paul Ryan 43% / 43% {0%}
- Mitt Romney 45% / 49% {-4%}
- Approve 48%
- Disapprove 50%
- He should 51%
- He should not 40%
- Barack Obama 56%
- Mitt Romney 35%
- Support 41%
- Oppose 47%
- Favorable 36%
- Unfavorable 44%
- Favorable 71%
- Unfavorable 14%
- Favorable 62%
- Unfavorable 25%
- Favorable 54%
- Unfavorable 26%
- Favorable 42%
- Unfavorable 25%
- Favorable 41%
- Unfavorable 33%
- Favorable 32%
- Unfavorable 16%
- More likely 34%
- Less likely 33%
- Didn't make a difference 33%
Sunday, September 02, 2012
Poll Watch: PPP (D) Florida 2012 Presidential Survey
PPP (D) Florida 2012 Presidential Poll
Survey of 1,548 likely Florida voters was conducted August 31 - September 2, 2012. The margin of error is +/- 2.5 percentage points. Party ID: 41% [42%] (41%) {41%} [42%] (40%) {42%} [41%] (42%) Democrat; 37% [40%] (40%) {41%} [38%] (37%) {36%} [37%] (40%) Republican; 21% [19%] (19%) {18%} [20%] (23%) {21%} [22%] (18%) Independent/Other. Political ideology: 36% [33%] (33%) {32%} [36%] (32%) {30%} [30%] Moderate; 25% [20%] (25%) {22%} [23%] (27%) {23%} [26%] Somewhat conservative; 16% [17%] (16%) {19%} [19%] (14%) {17%} [16%] Somewhat liberal; 13% [20%] (16%) {16%} [14%] (16%) {20%} [21%] Very conservative; 9% [10%] (10%) {10%} [9%] (10%) {10%} [7%] Very liberal. Results from the poll conducted July 26-29, 2012 are in square brackets. Results from the poll conducted May 31 - June 3, 2012 are in parentheses. Results from the poll conducted April 12-15, 2012 are in curly brackets. Results from the poll conducted November 28 - December 1, 2011 are in square brackets. Results from the poll conducted September 22-25, 2011 are in parentheses. Results from the poll conducted June 16-19, 2011 are in curly brackets. Results from the poll conducted March 24-27, 2011 are in square brackets. Results from the poll conducted December 17-20, 2010 are in parentheses.
- Barack Obama 48% [48%] (50%) {50%} [45%] (46%) {47%} [46%] (46%)
- Mitt Romney 47% [47%] (46%) {45%} [44%] (45%) {43%} [44%] (44%)
Among Men
Favorable / Unfavorable {Net}- Mitt Romney 48% [50%] (53%) {53%} [49%] (48%) {48%} [47%] (45%)
- Barack Obama 48% [45%] (43%) {43%} [40%] (42%) {44%} [42%] (46%)
- Barack Obama 49% [51%] (57%) {55%} [48%] (50%) {49%} [49%] (46%)
- Mitt Romney 47% [44%] (39%) {39%} [40%] (43%) {38%} [41%] (42%)
- Paul Ryan 47% / 40% {+7%}
- Mitt Romney 49% [46%] (39%) {41%} [37%] (40%) {41%} [39%] (43%) / 47% [49%] (53%) {51%} [47%] (46%) {45%} [39%] (38%) {+2%}
- Paul Ryan 38% / 48% {-10%}
- Mitt Romney 41% [34%] (24%) {34%} [40%] (27%) {42%} [33%] (31%) / 54% [58%] (62%) {54%} [43%] (55%) {44%} [44%] (43%) {-13%}
- Paul Ryan 49% / 40% {+9%}
- Mitt Romney 49% [49%] (45%) {49%} [42%] (44%) {46%} [42%] (44%) / 47% [48%] (46%) {46%} [47%] (42%) {42%} [37%] (43%) {+2%}
- Paul Ryan 44% / 40% {+4%}
- Mitt Romney 49% [43%] (32%) {34%} [32%] (37%) {37%} [36%] (42%) / 46% [50%] (60%) {56%} [47%] (49%) {46%} [40%] (32%) {+3%}
- Approve 47% [47%] (49%) {51%} [45%] (46%) {48%} [48%] (45%)
- Disapprove 50% [50%] (46%) {45%} [50%] (51%) {49%} [47%] (49%)
Among Moderates
- Approve 54% [57%] (60%) {64%} [53%] (64%) {59%} [73%] (62%)
- Disapprove 43% [40%] (32%) {30%} [39%] (32%) {37%} [24%] (30%)
Among Men
- Approve 46% [43%] (42%) {43%} [43%] (44%) {44%} [44%] (45%)
- Disapprove 51% [55%] (54%) {54%} [52%] (53%) {53%} [51%] (52%)
Among Women
- Approve 48% [50%] (57%) {58%} [46%] (47%) {52%} [52%] (45%)
- Disapprove 50% [46%] (38%) {38%} [48%] (50%) {45%} [42%] (46%)
- He should 49% [53%]
- He should not 41% [36%]
- Barack Obama 58%
- Mitt Romney 32%
- Support 37%
- Oppose 44%
- Favorable 36%
- Unfavorable 41%
- Favorable 72%
- Unfavorable 11%
- Favorable 66%
- Unfavorable 22%
- Favorable 56%
- Unfavorable 22%
- Favorable 41%
- Unfavorable 32%
- Favorable 35%
- Unfavorable 16%
- More likely 33%
- Less likely 33%
- Didn't make a difference 34%
Poll Watch: Rasmussen (R) 2012 Daily Swing State Presidential Tracking Survey
Rasmussen (R) 2012 Daily Swing State Presidential Tracking Poll
Survey of approximately 1,300 likely voters was conducted August 26 - September 1, 2012. The margin of error is +/- 3 percentage points. The swing state poll covers 11 key states: Colorado, Florida, Iowa, Michigan, Nevada, New Hampshire, North Carolina, Ohio, Pennsylvania, Virginia and Wisconsin. Results from the poll conducted August 25-31, 2012 are in parentheses. Results from the poll conducted August 24-30, 2012 are in curly brackets. Results from the poll conducted August 23-29, 2012 are in square brackets. Results from the poll conducted August 22-28, 2012 are in parentheses. Results from the poll conducted August 21-27, 2012 are in curly brackets. Results from the poll conducted August 20-26, 2012 are in square brackets. Results from the poll conducted August 19-25, 2012 are in parentheses.- Mitt Romney 46% (45%) {45%} [43%] (44%) {44%} [44%] (45%)
- Barack Obama 44% (45%) {45%} [46%] (47%) {47%} [48%] (46%)
- Some other candidate 4% (4%) {4%} [4%] (4%) {3%} [3%] (4%)
- Undecided 6% (6%) {6%} [6%] (6%) {6%} [5%] (5%)
The president’s job approval in the swing states is currently 48%. Fifty-one percent (51%) disapprove. Those figures include 25% who strongly approve and 40% who strongly disapprove.
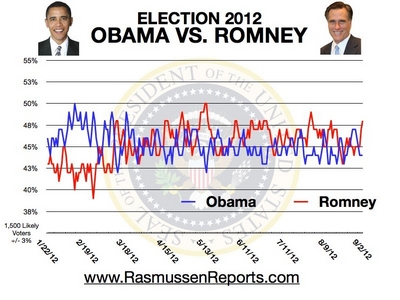
Poll Watch: Rasmussen (R) 2012 Daily Presidential Tracking Survey
Rasmussen (R) 2012 Daily Presidential Tracking Poll
- Mitt Romney 48%
- Barack Obama 44%
- Some other candidate 3%
- Undecided 5%
Survey of 1,500 likely voters was conducted August 30 - September 1, 2012. The margin of error is +/- 3 percentage points. Party ID: 35.97% Republican; 33.77% Democrat; 30.27% Independent. Daily tracking results are collected via telephone surveys of 500 likely voters per night and reported on a three-day rolling average basis. To reach those who have abandoned traditional landline telephones, Rasmussen Reports uses an online survey tool to interview randomly selected participants from a demographically diverse panel.

Saturday, September 01, 2012
Poll Watch: Gallup 2012 Daily Presidential Tracking Survey
Gallup 2012 Daily Presidential Tracking Poll
- Barack Obama 47%
- Mitt Romney 46%
Poll Watch: Rasmussen (R) 2012 Daily Swing State Presidential Tracking Survey
Rasmussen (R) 2012 Daily Swing State Presidential Tracking Poll
Survey of approximately 1,300 likely voters was conducted August 25-31, 2012. The margin of error is +/- 3 percentage points. The swing state poll covers 11 key states: Colorado, Florida, Iowa, Michigan, Nevada, New Hampshire, North Carolina, Ohio, Pennsylvania, Virginia and Wisconsin. Results from the poll conducted August 24-30, 2012 are in curly brackets. Results from the poll conducted August 23-29, 2012 are in square brackets. Results from the poll conducted August 22-28, 2012 are in parentheses. Results from the poll conducted August 21-27, 2012 are in curly brackets. Results from the poll conducted August 20-26, 2012 are in square brackets. Results from the poll conducted August 19-25, 2012 are in parentheses.- Barack Obama 45% {45%} [46%] (47%) {47%} [48%] (46%)
- Mitt Romney 45% {45%} [43%] (44%) {44%} [44%] (45%)
- Some other candidate 4% {4%} [4%] (4%) {3%} [3%] (4%)
- Undecided 6% {6%} [6%] (6%) {6%} [5%] (5%)
The president’s job approval in the swing states is currently 49%. Fifty percent (50%) disapprove. Those figures include 26% who strongly approve and 39% who strongly disapprove.
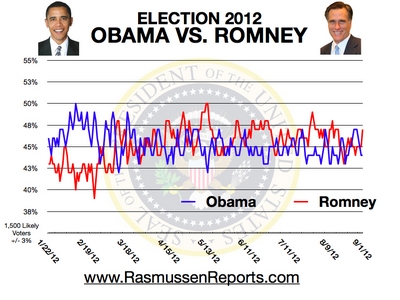
Poll Watch: Rasmussen (R) 2012 Daily Presidential Tracking Survey
Rasmussen (R) 2012 Daily Presidential Tracking Poll
- Mitt Romney 47%
- Barack Obama 44%
- Some other candidate 4%
- Undecided 6%
Survey of 1,500 likely voters was conducted August 29-31, 2012. The margin of error is +/- 3 percentage points. Daily tracking results are collected via telephone surveys of 500 likely voters per night and reported on a three-day rolling average basis. To reach those who have abandoned traditional landline telephones, Rasmussen Reports uses an online survey tool to interview randomly selected participants from a demographically diverse panel.

Subscribe to:
Posts (Atom)
