skip to main |
skip to sidebar
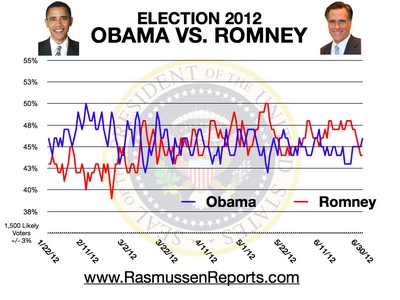
Survey of 1,500 likely voters was conducted June 27-29, 2012. The margin of error is +/- 3 percentage points. Daily tracking results are collected via telephone surveys of 500 likely voters per night and reported on a three-day rolling average basis. To reach those who have abandoned traditional landline telephones, Rasmussen Reports uses an online survey tool to interview randomly selected participants from a demographically diverse panel.
- Barack Obama 51% / 47% {+4%}
- Mitt Romney 49% / 49% {0%}
Do you approve or disapprove of the way Barack Obama is handling his job as president?
- Approve 45% {48%} [48%] (50%)
- Disapprove 54% {49%} [49%] (44%)
Do you approve or disapprove of President Obama's handling of the economy?
- Approve 47%
- Disapprove 49%
Do you approve or disapprove of President Obama's handling of foreign policy?
- Approve 48%
- Disapprove 47%
Do you approve or disapprove of President Obama's handling of health care?
- Approve 37%
- Disapprove 58%
Do you approve or disapprove of President Obama's handling of the federal budget deficit?
- Approve 44%
- Disapprove 54%
Do you approve or disapprove of President Obama's handling of creating jobs?
- Approve 46%
- Disapprove 52%
Do you think Barack Obama has done his job well enough to deserve reelection, or is it time to replace him with somebody else?
- Yes 42% {39%} [40%]
- No 48% {49%} [48%]
Here is a list of issues facing the country. For each, please indicate tell me who you think would do a better job of facing the issue – Republican Mitt Romney or Democrat Barack Obama.
The Economy
- Mitt Romney 52%
- Barack Obama 37%
Education
- Barack Obama 48%
- Mitt Romney 40%
Illegal Immigration
- Mitt Romney 41%
- Barack Obama 38%
Foreign Affairs
- Barack Obama 47%
- Mitt Romney 41%
Health Care
- Mitt Romney 48%
- Barack Obama 40%
Balancing the Budget
- Mitt Romney 48%
- Barack Obama 44%
Job Creation
- Barack Obama 40%
- Mitt Romney 39%
Reducing Government Spending
- Barack Obama 42%
- Mitt Romney 42%
Fighting Crime
- Mitt Romney 35%
- Barack Obama 33%
Holding the Line on Taxes
- Mitt Romney 45%
- Barack Obama 42%
Terrorism
- Barack Obama 45%
- Mitt Romney 36%
Regardless of how you might vote, do you consider Mitt Romney's experience with the investment firm Bain Capital a good thing or a bad thing in preparing him to be president, or does it not make much difference either way?
- Good thing 23%
- Bad thing 24%
- Doesn't make much difference 40%
Do you favor or oppose the Supreme Court decision that allows Arizona legal officials to verify the immigration status of those they stop that appear to be illegal immigrants, but takes away other provisions of the law that created new state crimes targeting illegal immigrants?
President Obama recently announced that the U.S. would stop deporting illegal immigrants if they came here before age 16, have been in the country for five years, have no criminal record, are in school or have a high school diploma or have been honorably discharged from the military. Do you agree or disagree with this new policy?
What do you think should happen to illegal immigrants working in the U.S.?
- They should be allowed to stay and apply for citizenship 34%
- They should be allowed to stay only as guest workers 19%
- They should have to leave the country 36%
Some say that President Obama is going to run his presidential campaign against an activist Supreme Court. They say he will attack the Court for its Citizen United decision that created Super PACS and for upholding the Arizona immigration law that enables police officers to check the identification of people on the streets that they suspect may be illegal immigrants. Do you approve or disapprove of this strategy?
- Approve 32%
- Disapprove 53%
Do you approve or disapprove of the Supreme Court's decision to uphold Obama's law entirely?
- Approve 45%
- Disapprove 50%
As part of the decision, the Court upheld the individual mandate requiring every citizen to purchase health care. Do you think the Supreme Court did the right thing upholding the individual mandate, or did they do the wrong thing, and should have invalidated the individual mandate?
- The Supreme Court did the right thing upholding the individual mandate 38%
- The Court did the wrong thing and should have invalidated the mandate 49%
Aside from this decision, do you favor or oppose the individual mandate, the government's requirement for Americans to purchase/get health insurance?
Who do you think wins politically as a result of the Supreme Court decision? President Obama and the Democrats, or Mitt Romney and the Republicans?
- President Obama and the Democrats 58%
- Mitt Romney and the Republicans 19%
Do you think taxes will go up as a result of the Supreme Court's ruling?
Do you think your health care costs will go up as a result of the Supreme Court's ruling?
Survey of 600 likely voters was conducted by Douglas Schoen, June 28, 2012. The margin of error is +/- 4 percentage points. Party registration: 32% Democrat; 30% Republican; 38% Independent. Ideology: 46% Moderate; 30% Conservative; 24% Liberal. Results from the poll conducted May 2-3, 2011 are in curly brackets. Results from the poll conducted April 30 - May 1, 2011 are in square brackets. Results from the poll conducted February 12-15, 2011 are in parentheses.
PPP (D) Massachusetts Poll on the Boston Red Sox
Do you consider yourself to be a Boston Red Sox fan, or not?
- Are a Red Sox fan 78% (81%)
- Are not 22% (19%)
(
Among Red Sox fans)
Do you approve or disapprove of the job Bobby Valentine is doing as manager?
- Approve 33%
- Disapprove 25%
Among Men
- Approve 40%
- Disapprove 28%
Among Women
- Approve 26%
- Disapprove 21%
(
Among Red Sox fans)
Do you think Bobby Valentine should continue to serve as manager of the Red Sox, or should he be fired?
- Valentine should continue as manager 52%
- He should be fired 17%
- Not sure 31%
Among Men
- Valentine should continue as manager 61%
- He should be fired 19%
- Not sure 20%
Among Women
- Valentine should continue as manager 44%
- He should be fired 14%
- Not sure 42%
(
Among Red Sox fans)
Would you like to see Terry Francona return as manager of the Red Sox someday, or not?
- Would like to see Francona return 46%
- Would not 27%
- Not sure 27%
Among Men
- Would like to see Francona return 46%
- Would not 37%
- Not sure 17%
Among Women
- Would like to see Francona return 47%
- Would not 17%
- Not sure 36%
(
Among Red Sox fans)
What do you think the outcome of the Red Sox season will be this year: win the World Series, win the American League but not the World Series, make the playoffs but not win the pennant, or miss the playoffs?
- Red Sox win the World Series 7% (20%)
- Red Sox win AL but not the Series 8% (19%)
- Red Sox make playoffs but don't win pennant 39% (43%)
- Red Sox miss the playoffs 40% (11%)
Among Men
- Red Sox win the World Series 8% (16%)
- Red Sox win AL but not the Series 4% (15%)
- Red Sox make playoffs but don't win pennant 41% (47%)
- Red Sox miss the playoffs 44% (16%)
Among Women
- Red Sox win the World Series 6% (24%)
- Red Sox win AL but not the Series 11% (23%)
- Red Sox make playoffs but don't win pennant 37% (40%)
- Red Sox miss the playoffs 35% (6%)
(
Among Red Sox fans)
Do you have a favorable or unfavorable opinion of Roger Clemens?
- Favorable 22% (23%)
- Unfavorable 59% (56%)
Among Men
- Favorable 27% (24%)
- Unfavorable 58% (60%)
Among Women
- Favorable 18% (21%)
- Unfavorable 59% (51%)
Survey of 902 Massachusetts voters was conducted June 22-24, 2012. The margin of error is +/- 3.3 percentage points. Results from the poll conducted March 16-18, 2012 are in parentheses.
PPP (D) Massachusetts 2012 Political Poll
Do you approve or disapprove of Governor Deval Patrick’s job performance?
- Approve 49% (48%)
- Disapprove 43% (37%)
Do you approve or disapprove of Senator John Kerry’s job performance?
- Approve 53% (50%)
- Disapprove 38% (38%)
Do you approve or disapprove of Senator Scott Brown’s job performance?
- Approve 51% (45%)
- Disapprove 38% (42%)
Do you have a higher opinion of Scott Brown or John Kerry?
- John Kerry 47% (46%)
- Scott Brown 43% (39%)
- Like both equally 7% (9%)
Would you support or oppose a proposal to legalize medical marijuana in Massachusetts?
- Support 57% (53%)
- Oppose 33% (35%)
Would you support or oppose a proposal to legalize assisted suicide in Massachusetts?
- Support 45% (43%)
- Oppose 36% (37%)
Do you think same-sex marriage should be legal or illegal?
- Legal 62% (58%)
- Illegal 30% (31%)
Which of the following best describes your opinion on gay marriage: gay couples should be allowed to legally marry, or gay couples should be allowed to form civil unions but not legally marry, or there should be no legal recognition of a gay couple's relationship?
- Gay couples should be allowed to legally marry 58% (55%)
- Gay couples should be allowed to form civil unions but not marry 30% (31%)
- There should be no legal recognition of a gay couple's relationship 11% (12%)
Has the legalization of gay marriage in Massachusetts had a positive or negative
impact on your life, or has it not had any impact at all?
- Positive 20% (19%)
- Negative 16% (14%)
- Hasn't made any impact at all 64% (67%)
Do you have a favorable or unfavorable opinion of the Kennedys?
- Favorable 49%
- Unfavorable 32%
Survey of 902 Massachusetts voters was conducted June 22-24, 2012. The margin of error is +/- 3.3 percentage points. Party
ID: 39% (41%) Democrat; 13% (14%) Republican; 48% (45%) Independent/Other. Political
views: 35% (36%) Moderate; 25% (27%) Somewhat
liberal; 19% (21%) Somewhat conservative; 13% (11%) Very liberal; 8% (5%) Very conservative. Results from the poll conducted March 16-18, 2012 are in parentheses.
Democracy Corps (D) 2012 Presidential Poll
- Barack Obama 49% {47%} [49%] (47%) {45%} [48%] (47%) {48%} [46%] (48%)
- Mitt Romney 46% {47%} [45%] (46%) {45%} [46%] (45%) {44%} [48%] (46%)
I am going to read you a list of issues and I want you to tell me whether, overall, you think Barack Obama or Mitt Romney would do a better job with each issue.
The economy
- Mitt Romney 45%
- Barack Obama 44%
Having the right approach to taxes
- Barack Obama 44%
- Mitt Romney 42%
On your side
- Barack Obama 44%
- Mitt Romney 37%
Sharing my values
- Barack Obama 45%
- Mitt Romney 43%
Looking out for the middle class
- Barack Obama 49%
- Mitt Romney 41%
Do you approve or disapprove of the way Barack Obama is handling his job as president?
- Approve 47% {45%} [50%] (44%) {40%} [45%] (46%) {49%} [44%] (47%)
- Disapprove 48% {50%} [46%] (49%) {53%} [50%] (48%) {45%} [50%] (47%)
Do you approve or disapprove of the way the Republicans in Congress are handling their job in charge of the House of Representatives?
- Approve 32% {28%} [26%] (26%) {27%} [31%] (32%) {33%} [38%]
- Disapprove 62% {63%} [68%] (66%) {65%} [64%] (60%) {59%} [55%]
I know it is a long way off, but thinking about the elections for Congress in 2012, if the election for U.S. Congress were held today, would you be voting for the Democratic House candidate or the Republican House candidate?
- Republican candidate 46% {45%} [45%] (44%) {46%} [47%] (47%) {45%} [47%] (47%)
- Democratic candidate 45% {46%} [47%] (47%) {46%} [46%] (44%) {46%} [45%] (44%)
Survey of 1,000 likely voters was conducted June 23-27, 2012 by Greenberg Quinlan Rosner. The margin of error is +/- 3.1 percentage points. Party ID: 37% {37%} [39%] (40%) {35%} [38%] (35%) {38%} [38%] (34%) Democrat; 31% {31%} [31%] (31%) {31%} [33%] (32%) {31%} [36%] (34%) Republican; 28% {29%} [26%] (26%) {32%} [26%] (30%) {28%} [23%] (28%) Independent. Political ideology: 39% {39%} [41%] (41%) {38%} [42%] (43%) {41%} [43%] (42%) Conservative; 33% {32%} [30%] (35%) {36%} [35%] (33%) {31%} [34%] (34%) Moderate; 21% {21%} [22%] (19%) {19%} [20%] (19%) {21%} [18%] (18%) Liberal. Results from the poll conducted April 28 - May 1, 2012 are in curly brackets. Results from the poll conducted February 11-14, 2012 are in square brackets. Results from the poll conducted January 8-11, 2012 are in parentheses. Results from the poll conducted October 15-18, 2011 are in curly brackets. Results from the poll conducted August 6-10, 2011 are in square brackets. Results from the poll conducted June 18-21, 2011 are in parentheses. Results from the poll conducted May 21-25, 2011 are in curly brackets. Results from the poll conducted April 10-12, 2011 are in square brackets. Results from the poll conducted January 9-12, 2011 are in parentheses. It is important to note that Obama’s gains have come entirely from the Rising American Electorate (youth, unmarried women, African Americans and Latinos) – the broad coalition of voters who supported him enthusiastically in 2008. These voters are beginning to come back. Obama has moved his vote up from 60 to 63 percent with the Rising American Electorate and Romney has slipped a like amount. The gains have come with African Americans (Obama’s vote is up from 88 to 95 percent) and unmarried women (up from 60 to 63 percent). African American gains are driving up the youth vote, but Romney has fallen off with whites under 30 years old. This vote is still well short of 2008, but Obama has improved his vote margin with young people by 15 points since the beginning of this year.
Obama has moved slightly ahead among independents (46 to 44 percent) after trailing slightly in previous polls — and he has consolidated his bloc more than Romney — with only 1 percent vulnerable in our Obama Voter Choice Scale.
Survey of 1,500 likely voters was conducted June 26-28, 2012. The margin of error is +/- 3 percentage points. Daily tracking results are collected via telephone surveys of 500 likely voters per night and reported on a three-day rolling average basis. To reach those who have abandoned traditional landline telephones, Rasmussen Reports uses an online survey tool to interview randomly selected participants from a demographically diverse panel.
SurveyUSA California Poll on Supreme Court Ruling on ObamaCare
The Supreme Court has ruled that the key provisions of the health care reform law are constitutional. Do you agree with the Supreme Court decision? Disagree with the decision? Or do you not know enough to say?
- Agree 44%
- Disagree 45%
- Don't know enough 11%
Democrats
- Agree 72%
- Disagree 19%
- Don't know enough 9%
Republicans
- Agree 20%
- Disagree 71%
- Don't know enough 9%
Independents
- Agree 36%
- Disagree 48%
- Don't know enough 16%
Men
- Agree 46%
- Disagree 49%
- Don't know enough 5%
Women
- Agree 41%
- Disagree 40%
- Don't know enough 19%
As a result of this Supreme Court ruling, will the health care you personally receive, get better, get worse, or stay the same?
- Get better 23%
- Get worse 38%
- Stay about the same 34%
Democrats
- Get better 33%
- Get worse 20%
- Stay about the same 45%
Republicans
- Get better 9%
- Get worse 55%
- Stay about the same 30%
Independents
- Get better 27%
- Get worse 40%
- Stay about the same 27%
Men
- Get better 27%
- Get worse 39%
- Stay about the same 30%
Women
- Get better 18%
- Get worse 36%
- Stay about the same 40%
As a result of this Supreme Court ruling, will the health care you personally receive become more expensive, become less expensive, or stay the same?
- More expensive 48%
- Less expensive 16%
- Stay the same 31%
Democrats
- More expensive 25%
- Less expensive 22%
- Stay the same 47%
Republicans
- More expensive 69%
- Less expensive 3%
- Stay the same 21%
Independents
- More expensive 53%
- Less expensive 21%
- Stay the same 22%
Men
- More expensive 51%
- Less expensive 18%
- Stay the same 26%
Women
- More expensive 44%
- Less expensive 12%
- Stay the same 38%
Regardless of how you may feel about the Supreme Court decision, should everyone in the United States be required to have health insurance? Or should every individual be allowed to choose whether to have health insurance?
- Everyone should be required to have insurance 43%
- Every individual should be allowed to choose 52%
Democrats
- Everyone should be required to have insurance 67%
- Every individual should be allowed to choose 25%
Republicans
- Everyone should be required to have insurance 15%
- Every individual should be allowed to choose 81%
Independents
- Everyone should be required to have insurance 43%
- Every individual should be allowed to choose 55%
Men
- Everyone should be required to have insurance 41%
- Every individual should be allowed to choose 54%
Women
- Everyone should be required to have insurance 46%
- Every individual should be allowed to choose 49%
Regardless of how you may feel about the Supreme Court decision, should insurance companies be able to deny health insurance to those who have pre-existing medical conditions? Or should insurance companies be required to cover everyone who wants to buy insurance?
- Able to deny those with pre-existing conditions 11%
- Required to cover everyone who wants to buy insurance 84%
Democrats
- Able to deny those with pre-existing conditions 6%
- Required to cover everyone who wants to buy insurance 91%
Republicans
- Able to deny those with pre-existing conditions 13%
- Required to cover everyone who wants to buy insurance 81%
Independents
- Able to deny those with pre-existing conditions 17%
- Required to cover everyone who wants to buy insurance 79%
Men
- Able to deny those with pre-existing conditions 13%
- Required to cover everyone who wants to buy insurance 83%
Women
- Able to deny those with pre-existing conditions 9%
- Required to cover everyone who wants to buy insurance 85%
Survey of 514 adults following news stories about the Supreme Court decision on health care was conducted June 28, 2012. The margin of error is +/- 4.4 percentage points. Party ID: 37% Democrat; 32% Republican; 28% Independent. Ideology: 41% Moderate; 33% Conservative; 21% Liberal.
SurveyUSA Florida Poll on Supreme Court Ruling on ObamaCare
The Supreme Court has ruled that the key provisions of the health care reform law are constitutional. Do you agree with the Supreme Court decision? Disagree with the decision? Or do you not know enough to say?
- Agree 39%
- Disagree 50%
- Don't know enough 11%
Democrats
- Agree 64%
- Disagree 22%
- Don't know enough 14%
Republicans
- Agree 14%
- Disagree 79%
- Don't know enough 7%
Independents
- Agree 36%
- Disagree 54%
- Don't know enough 10%
Men
- Agree 41%
- Disagree 55%
- Don't know enough 4%
Women
- Agree 38%
- Disagree 46%
- Don't know enough 17%
As a result of this Supreme Court ruling, will the health care you personally receive, get better, get worse, or stay the same?
- Get better 20%
- Get worse 47%
- Stay about the same 27%
Democrats
- Get better 34%
- Get worse 21%
- Stay about the same 33%
Republicans
- Get better 6%
- Get worse 74%
- Stay about the same 19%
Independents
- Get better 18%
- Get worse 48%
- Stay about the same 29%
Men
- Get better 18%
- Get worse 52%
- Stay about the same 24%
Women
- Get better 22%
- Get worse 42%
- Stay about the same 30%
As a result of this Supreme Court ruling, will the health care you personally receive become more expensive, become less expensive, or stay the same?
- More expensive 51%
- Less expensive 12%
- Stay the same 31%
Democrats
- More expensive 30%
- Less expensive 15%
- Stay the same 49%
Republicans
- More expensive 75%
- Less expensive 7%
- Stay the same 13%
Independents
- More expensive 50%
- Less expensive 15%
- Stay the same 29%
Men
- More expensive 52%
- Less expensive 16%
- Stay the same 26%
Women
- More expensive 50%
- Less expensive 8%
- Stay the same 36%
Regardless of how you may feel about the Supreme Court decision, should everyone in the United States be required to have health insurance? Or should every individual be allowed to choose whether to have health insurance?
- Everyone should be required to have insurance 36%
- Every individual should be allowed to choose 61%
Democrats
- Everyone should be required to have insurance 59%
- Every individual should be allowed to choose 39%
Republicans
- Everyone should be required to have insurance 13%
- Every individual should be allowed to choose 86%
Independents
- Everyone should be required to have insurance 35%
- Every individual should be allowed to choose 58%
Moderates
- Everyone should be required to have insurance 47%
- Every individual should be allowed to choose 50%
Men
- Everyone should be required to have insurance 37%
- Every individual should be allowed to choose 61%
Women
- Everyone should be required to have insurance 36%
- Every individual should be allowed to choose 60%
Regardless of how you may feel about the Supreme Court decision, should insurance companies be able to deny health insurance to those who have pre-existing medical conditions? Or should insurance companies be required to cover everyone who wants to buy insurance?
- Able to deny those with pre-existing conditions 15%
- Required to cover everyone who wants to buy insurance 78%
Democrats
- Able to deny those with pre-existing conditions 6%
- Required to cover everyone who wants to buy insurance 85%
Republicans
- Able to deny those with pre-existing conditions 27%
- Required to cover everyone who wants to buy insurance 68%
Independents
- Able to deny those with pre-existing conditions 14%
- Required to cover everyone who wants to buy insurance 80%
Men
- Able to deny those with pre-existing conditions 21%
- Required to cover everyone who wants to buy insurance 76%
Women
- Able to deny those with pre-existing conditions 10%
- Required to cover everyone who wants to buy insurance 80%
Survey of 539 adults following news stories about the Supreme Court decision on health care was conducted June 28, 2012. The margin of error is +/- 4.3 percentage points. Party ID: 39% Democrat; 34% Republican; 27% Independent. Ideology: 41% Moderate; 38% Conservative; 18% Liberal.
Rasmussen (R) Arizona 2012 Senate Poll
- Jeff Flake (R) 47% (47%)
- Richard Carmona (D) 31% (34%)
- Some other candidate 5% (3%)
- Undecided 17% (16%)
- Wil Cardon (R) 38% (39%)
- Richard Carmona (D) 38% (38%)
- Some other candidate 5% (3%)
- Undecided 19% (20%)
Survey of 500 likely voters was conducted June 26, 2012. The margin of error is +/- 4.5 percentage points. Results from the poll conducted March 13, 2012 are in parentheses.
Inside the numbers:
Flake earns the support of 82% of Republicans, while Cardon is favored by just 65% of the voters in his own party. Carmona picks up 77% Democratic support against Cardon but just 69% against Flake. Both GOP candidates lead Carmona among voters not affiliated with either political party.
Among all voters in Arizona, 19% have a Very Favorable impression of Flake, while 12% share a Very Unfavorable view of him.
Cardon is viewed Very Favorably by seven percent (7%) and Very Unfavorably by 16%.
Carmona is seen Very Favorably by 12% and Very Unfavorably by 12%.
Thirty-four percent (34%) of Arizona voters agree with the U.S. Supreme Court’s ruling earlier this week on the state’s controversial immigration law, but a plurality (42%) disagree with that decision. Twenty-three percent (23%) are undecided.
Among those voters in the state who agree with the ruling, Flake leads Carmona 41% to 35%, while Carmona is ahead 50% to 31% when pitted against Cardon. Both Republicans hold a sizable lead among those who disagree with the ruling.
NBC News/Marist Michigan 2012 Senate Poll
- Debbie Stabenow (D) 49% (53%)
- Pete Hoekstra (R) 37% (32%)
- Undecided 14% (15%)
Survey of 1,078 registered voters was conducted June 24-25, 2012. The margin of error is +/- 3.0 percentage points. Results from the poll conducted February 19-20, 2012 are in parentheses.
NBC News/Marist North Carolina 2012 Presidential Poll
- Barack Obama 46%
- Mitt Romney 44%
- Other 1%
- Undecided 9%
Favorable / Unfavorable {Net}
- Barack Obama 48% / 45% {+3%}
- Mitt Romney 40% / 42% {-2%}
Do you approve or disapprove of the job Barack Obama is doing as president?
- Approve 47%
- Disapprove 47%
Which candidate will do a better job handling the economy:
- Barack Obama 43%
- Mitt Romney 43%
Which candidate will do a better job handling foreign policy:
- Barack Obama 48%
- Mitt Romney 37%
Survey of 1,019 registered voters was conducted June 24-25, 2012. The margin of error is +/- 3.1 percentage points.
Survey of 1,500 likely voters was conducted June 25-27, 2012. The margin of error is +/- 3 percentage points. Daily tracking results are collected via telephone surveys of 500 likely voters per night and reported on a three-day rolling average basis. To reach those who have abandoned traditional landline telephones, Rasmussen Reports uses an online survey tool to interview randomly selected participants from a demographically diverse panel.
NBC News/Marist Michigan 2012 Presidential Poll
- Barack Obama 47% (51%)
- Mitt Romney 43% (33%)
Favorable / Unfavorable {Net}
- Barack Obama 51% / 41% {+10%}
- Mitt Romney 37% / 43% {-6%}
Do you approve or disapprove of the job Barack Obama is doing as president?
- Approve 48% (51%)
- Disapprove 42% (38%)
Which candidate will do a better job handling the economy:
- Barack Obama 44%
- Mitt Romney 42%
Which candidate will do a better job handling foreign policy:
- Barack Obama 50%
- Mitt Romney 34%
Survey of 1,078 registered voters was conducted June 24-25, 2012. The margin of error is +/- 3.0 percentage points. Results from the poll conducted February 19-20, 2012 are in parentheses.
NBC News/Marist New Hampshire 2012 Presidential Poll
- Barack Obama 45% [43%] (40%)
- Mitt Romney 45% [46%] (49%)
How about if the candidates are:
- Barack Obama-Joe Biden 45%
- Mitt Romney-Kelly Ayotte 43%
Favorable / Unfavorable {Net}
- Barack Obama 50% / 44% {+6%}
- Mitt Romney 45% / 45% {0%}
Do you approve or disapprove of the job Barack Obama is doing as president?
- Approve 47% [40%] (38%)
- Disapprove 45% [52%] (53%)
Which candidate will do a better job handling the economy:
- Mitt Romney 46%
- Barack Obama 42%
Which candidate will do a better job handling foreign policy:
- Barack Obama 49%
- Mitt Romney 39%
Survey of 1,029 registered voters was conducted June 24-25, 2012. The margin of error is +/- 3.1 percentage points. Results from the poll conducted November 28-30, 2011 are in square brackets. Results from the poll conducted October 3-5, 2011 are in parentheses.
Fox News 2012 Presidential Poll
- Barack Obama 45% {43%} (46%) [46%] {44%} (46%) [47%] {46%} (44%) [42%] {45%} (47%) [48%] {48%}
- Mitt Romney 40% {43%} (39%) [46%] {46%} (42%) [42%] {45%} {42%} [44%] {42%} (41%) [41%] {41%}
Among Men
- Barack Obama 45% {41%} (37%) [45%] {38%} [42%]
- Mitt Romney 40% {46%} (46%) [49%] {52%} [47%]
Among Women
- Barack Obama 46% {46%} (55%) [47%] {49%} [50%]
- Mitt Romney 39% {40%} (33%) [42%] {41%} [38%]
Definite Voters
- Barack Obama 46%
- Mitt Romney 43%
Extremely Interested Voters
- Mitt Romney 49%
- Barack Obama 44%
Do you approve or disapprove of the job Barack Obama is doing as president?
- Approve 48% {49%} (49%) [45%] {42%} (47%) [48%] {45%} (44%) [42%] {43%} (45%) [48%] {51%}
- Disapprove 43% {45%} (47%) [51%] {51%} (45%) [45%] {47%} (51%) [48%] {51%} (46%) [43%] {43%}
Do you approve or disapprove of the job Barack Obama is doing on the following issues?
Health Care
- Approve 43% (44%) (43%)
- Disapprove 51% (51%) (52%)
The Economy
- Approve 43% (43%) (42%)
- Disapprove 52% (53%) (54%)
Immigration
- Approve 43% (38%)
- Disapprove 45% (49%)
The Federal Deficit
- Approve 37% (36%) (35%)
- Disapprove 56% (59%) (56%)
Do you think Barack Obama has a clear plan for improving the economy, or not?
- Yes 41% [36%]
- No 53% [61%]
Do you think Mitt Romney has a clear plan for improving the economy, or not?
- Yes 27% [31%]
- No 55% [58%]
Who do you think will do a better job looking out for you and your family during tough economic times?
- Barack Obama 47%
- Mitt Romney 36%
In a 2009 interview, President Barack Obama said that it was up to him to get the economy back on track in three years and if that didn’t happen then he would be a one-term president. If voters hold Obama accountable on getting the economy back on track, do you think he would deserve re-election or not?
- Yes, he would 48%
- No, he wouldn't 47%
In general, do you think Barack Obama is running: 1. A positive campaign, focused on the issues 2. A negative campaign, focused on attacks?
- Positive campaign 52%
- Negative campaign 31%
In general, do you think Mitt Romney is running: 1. A positive campaign, focused on the issues 2. A negative campaign, focused on attacks?
- Positive campaign 36%
- Negative campaign 40%
As you may have heard, President Barack Obama announced the government will stop deportation and grant work permits for certain illegal immigrants under the age of thirty who were brought to the United States as children. Do you favor or oppose this change to immigration policy?
President Obama has repeatedly said in the past that he could not bypass Congress and suspend deportations on his own because quote, “That’s not how our system works. That’s not how our democracy functions. That’s not how our Constitution is written.” Yet now President Obama has announced the Department of Homeland Security will stop deporting illegal immigrants under age 30 who were brought to this country as children. Do you think the Obama administration violated the Constitution or did the administration find a lawful way to get around the president’s Constitutional concerns?
- Violated the Constitution 27%
- Found a lawful way around Constitutional concerns 54%
What do you think was the main motivation behind President Obama’s decision to change the country’s immigration policy?
- He truly believes it was the right thing to do 34%
- His desire to get more of the Hispanic and Latino vote in the election 50%
In 2010, Arizona passed an immigration law that requires people to show documents proving their immigration status, if government officials have reasonable cause to ask for them, and allows police to detain anyone who cannot prove their immigration status. Setting aside this week’s Supreme Court ruling, do you favor or oppose this law?
Survey of 912 registered voters was conducted by Anderson Robbins Research (D)/Shaw & Company Research (R) June 24-26, 2012. The margin of error is ± 3 percentage points. Results from the poll conducted June 3-5, 2012 are in curly brackets. Results from the poll conducted May 13-15, 2012 are in parentheses. Results from the poll conducted April 22-24, 2012 are in square brackets. Results from the poll conducted April 9-11, 2012 are in curly brackets. Results from the poll conducted March 10-12, 2012 are in parentheses. Results from the poll conducted February 6-9, 2012 are in square brackets. Results from the poll conducted January 12-14, 2012 are in curly brackets. Results from the poll conducted December 5-7, 2011 are in parentheses. Results from the poll conducted November 13-15, 2011 are in square brackets. Results from the poll conducted September 25-27, 2011 are in curly brackets. Results from the poll conducted July 17-19, 2011 are in parentheses. Results from the poll conducted June 5-7, 2011 are in square brackets. Results from the poll conducted February 7-9, 2011 are in curly brackets.
Among Registered Voters
- Barack Obama 66% (61%)
- Mitt Romney 26% (27%)
And, if the next election for president were held today, for whom would you vote if the choices were Mitt Romney the Republican candidate, Barack Obama the Democratic candidate, or an Independent candidate?
- Barack Obama 56%
- Mitt Romney 19%
- Independent 16%
Rate your feelings toward each one as very positive, somewhat positive, neutral, somewhat negative, or very negative.
Barack Obama
- Very positive 41% (31%)
- Somewhat positive 26% (27%)
- Neutral 14% (17%)
- Somewhat negative 6% (11%)
- Very negative 12% (12%)
Mitt Romney
- Very positive 5% (6%)
- Somewhat positive 16% (20%)
- Neutral 26% (21%)
- Somewhat negative 18% (14%)
- Very negative 23% (21%)
Democratic Party
- Very positive 22% (24%)
- Somewhat positive 30% (27%)
- Neutral 26% (26%)
- Somewhat negative 9% (8%)
- Very negative 8% (11%)
Republican Party
- Very positive 6% (7%)
- Somewhat positive 16% (15%)
- Neutral 27% (31%)
- Somewhat negative 20% (15%)
- Very negative 25% (25%)
In general, do you approve or disapprove of the job Barack Obama is doing as president?
- Approve 65% (61%)
- Disapprove 27% (32%)
Do you generally approve or disapprove of the job Barack Obama is doing in handling the economy?
- Approve 62% (54%)
- Disapprove 32% (38%)
Have you seen, read, or heard the news coverage about the Obama administration’s announcement of a new policy that would stop the deportation of illegal immigrants who today are younger than thirty years old and were brought to the United States as children? (
IF YES:)
And, have you seen, read, or heard a lot or just some about this?
- Yes, a lot 49%
- Yes, just some 35%
- No 14%
This new policy would apply for now to those who came to the United States before they were 16 and who are younger than 30 if they have lived here for five years, have no criminal history, and graduated from a U.S. high school or served in the military. The policy would allow them to attend college and work in the U.S. legally. Now, having heard some information about this policy, would you say you favor or oppose it?
- Strongly favor 63%
- Somewhat favor 24%
- Somewhat oppose 4%
- Strongly oppose 6%
I'm going to read you two statements about the role of government, and I'd like to know which one comes closer to your point of view.
Statement A: Government should do more to solve problems and help meet the needs of people,
OR
Statement B: Government is doing too many things better left to businesses and individuals.
- A/Government should do more 64%
- B/Government is doing too many things 30%
What is your preference for the outcome of this year's congressional elections -- a Congress controlled by Republicans or a Congress controlled by Democrats?
Among Registered Voters
- Democrat-controlled Congress 66% (58%)
- Republican-controlled Congress 27% (30%)
Survey of 300 Hispanic/Latino adults, including a subsample of 203 registered Hispanic/Latino voters (65% of whom say they are almost certain to vote), was conducted June 20-24, 2012. The margin of error is +/- 5.66 percentage points among adults; +/- 6.88 percentage points among registered voters. Results from the poll conducted May 16-21, 2012 are in parentheses.
PPP (D) Ohio 2012 Senate Poll
- Sherrod Brown (D) 46% [45%] (47%) {49%} [48%] (48%) {48%} [48%]
- Josh Mandel (R) 39% [37%] (36%) {34%} [40%] (33%) {31%} [32%]
Favorable / Unfavorable {Net}
- Josh Mandel 24% [25%] (14%) {14%} [12%] (14%) {15%} [13%] / 39% [30%] (25%) {19%} [21%] (20%) {18%} [12%] {-15%}
Do you approve or disapprove of Senator Sherrod Brown's job performance?
- Approve 38% [40%] (42%) {42%} [40%] (37%) {39%} [40%] (40%)
- Disapprove 42% [35%] (34%) {33%} [35%] (34%) {28%} [30%] (37%)
Survey of 673 Ohio voters was conducted June 21-24, 2012. The margin of error is +/- 3.8 percentage points. Party ID: 39% [41%] (42%) {41%} [47%] (44%) {45%} [43%] (44%) Democrat; 37% [39%] (36%) {35%} [37%] (34%) {35%} [35%] (39%) Republican; 24% [20%] (21%) {24%} [16%] (22%) {20%} [21%] (18%) Independent/Other. Political views: 31% [31%] (30%) {31%} [30%] (31%) {33%} [29%] Moderate; 27% [22%] (21%) {25%} [19%] (24%) {25%} [28%] Somewhat conservative; 17% [18%] (18%) {20%} [21%] (19%) {16%} [19%] Somewhat liberal; 15% [19%] (21%) {18%} [19%] (17%) {13%} [15%] Very conservative; 9% [9%] (10%) {7%} [10%] (8%) {13%} [7%] Very liberal. Results from the poll conducted May 3-6, 2012 are in square brackets. Results from the poll conducted January 28-29, 2012 are in parentheses. Results from the poll conducted November 4-6, 2011 are in curly brackets. Results from the poll conducted October 13-16, 2011 are in square brackets. Results from the poll conducted August 11-14, 2011 are in parentheses. Results from the poll conducted May 19-22, 2011 are in curly brackets. Results from the poll conducted March 10-13, 2011 are in square brackets. Results from the poll conducted December 10-12, 2010 are in parentheses.